How to Backtest Trading Strategies Effectively: The Complete TradingView Pine Script Guide
Learn how to properly backtest your trading strategies using TradingView's Pine Script. This comprehensive guide covers statistical validation, avoiding overfitting, and interpreting backtest results to develop profitable strategies.

Effective backtesting is the cornerstone of successful algorithmic trading. Without rigorous validation, even the most promising trading strategy can fail when deployed in live markets. In this comprehensive guide, we'll walk through the complete process of backtesting trading strategies using TradingView's Pine Script language – from basic concepts to advanced techniques that professional traders use to validate their systems.
What You'll Learn
- Why proper backtesting is critical for trading success
- How to set up a Pine Script strategy for accurate backtesting
- Common backtesting mistakes and how to avoid them
- Advanced techniques for statistical validation
- How to interpret backtest results and make data-driven decisions
- Methods to prevent overfitting and curve-fitting
Why Proper Backtesting Matters
Many beginner traders make a critical mistake: they develop a strategy, run a single backtest that shows profit, and immediately start trading with real money. This approach often leads to disappointment and financial loss.
Here's why comprehensive backtesting is essential:
- Market Conditions Change: A strategy that worked well in a bull market might fail completely during ranging or bear markets.
- Statistical Significance: A short-term backtest might show profits due to pure luck rather than a genuine edge in the market.
- Risk Assessment: Proper backtesting reveals not just potential returns but also drawdowns, volatility, and other risk metrics critical for position sizing.
- Strategy Refinement: Systematic testing helps you identify weaknesses in your strategy that can be improved.
Let's dive into how to properly backtest using TradingView's Pine Script.
Setting Up a Basic Backtest in Pine Script
TradingView provides a powerful platform for strategy backtesting through its Pine Script language. Here's how to set up a basic backtest:
//@version=5
strategy("My Backtest Strategy", overlay=true, initial_capital=10000)

// Define your strategy logic
longCondition = ta.crossover(ta.sma(close, 14), ta.sma(close, 28))
shortCondition = ta.crossunder(ta.sma(close, 14), ta.sma(close, 28))

// Execute trades
if (longCondition)
    strategy.entry("Long", strategy.long)

if (shortCondition)
    strategy.close("Long")

// Optionally add take profit and stop loss
strategy.exit("TP/SL", "Long", profit=100, loss=50)
This simple example creates a strategy that goes long when the 14-period SMA crosses above the 28-period SMA, and closes the position when the opposite occurs. It also includes a fixed take profit of 100 points and stop loss of 50 points.
Critical Backtest Parameters
The default settings in TradingView might not provide realistic results. Here are the key parameters you should adjust:
Date Range and Market Phases
Test your strategy across different market conditions:
strategy("Market Phase Testing", overlay=true,
         date_from=timestamp("2018-01-01"),
         date_to=timestamp("2023-01-01"))
A robust strategy should perform reasonably well across:
- Bull markets
- Bear markets
- Sideways/ranging markets
- High volatility periods
- Low volatility periods
Commission and Slippage
Real trading incurs costs. Add them to your backtest for realism:
strategy("Realistic Costs", overlay=true,
         commission_type=strategy.commission.percent,
         commission_value=0.1, // 0.1% per trade
         slippage=2) // 2 ticks slippage
Neglecting these costs often leads to overly optimistic results that won't translate to live trading.
Common Backtesting Mistakes to Avoid
1. Overfitting (Curve-Fitting)
Overfitting occurs when you optimize a strategy to perform exceptionally well on historical data but fails on future data. Signs of overfitting include:
- Excessive parameter optimization
- Too many rules and conditions
- Perfect entries and exits
- Extremely high win rates
Solution: Use out-of-sample testing. Develop your strategy on one dataset (e.g., 2018-2020) and validate it on another (e.g., 2021-2023) without making further adjustments.
2. Look-Ahead Bias
This occurs when your strategy unintentionally uses future information that wouldn't be available at the time of trade execution.
Example of look-ahead bias:
// Incorrect - uses future prices
if (close[0] > close[5])
    strategy.entry("Long", strategy.long)
Corrected version:
// Correct - only uses past information
if (close[5] > close[10])
    strategy.entry("Long", strategy.long)
3. Survivorship Bias
Testing only on current market symbols ignores stocks/assets that no longer exist, potentially skewing results.
Solution: For stock strategies, test on delisted securities when possible or at least be aware of this limitation.
Advanced Backtesting Techniques
Monte Carlo Simulation
While not directly available in Pine Script, you can export TradingView results and run Monte Carlo simulations to understand the range of possible outcomes by randomizing the sequence of trades.
Walk-Forward Analysis
This combines in-sample optimization with out-of-sample testing in a systematic way:
- Divide your data into segments
- Optimize on segment 1, test on segment 2
- Optimize on segments 1+2, test on segment 3
- Continue this process
This helps validate that your strategy can adapt to changing market conditions.
Interpreting Backtest Results
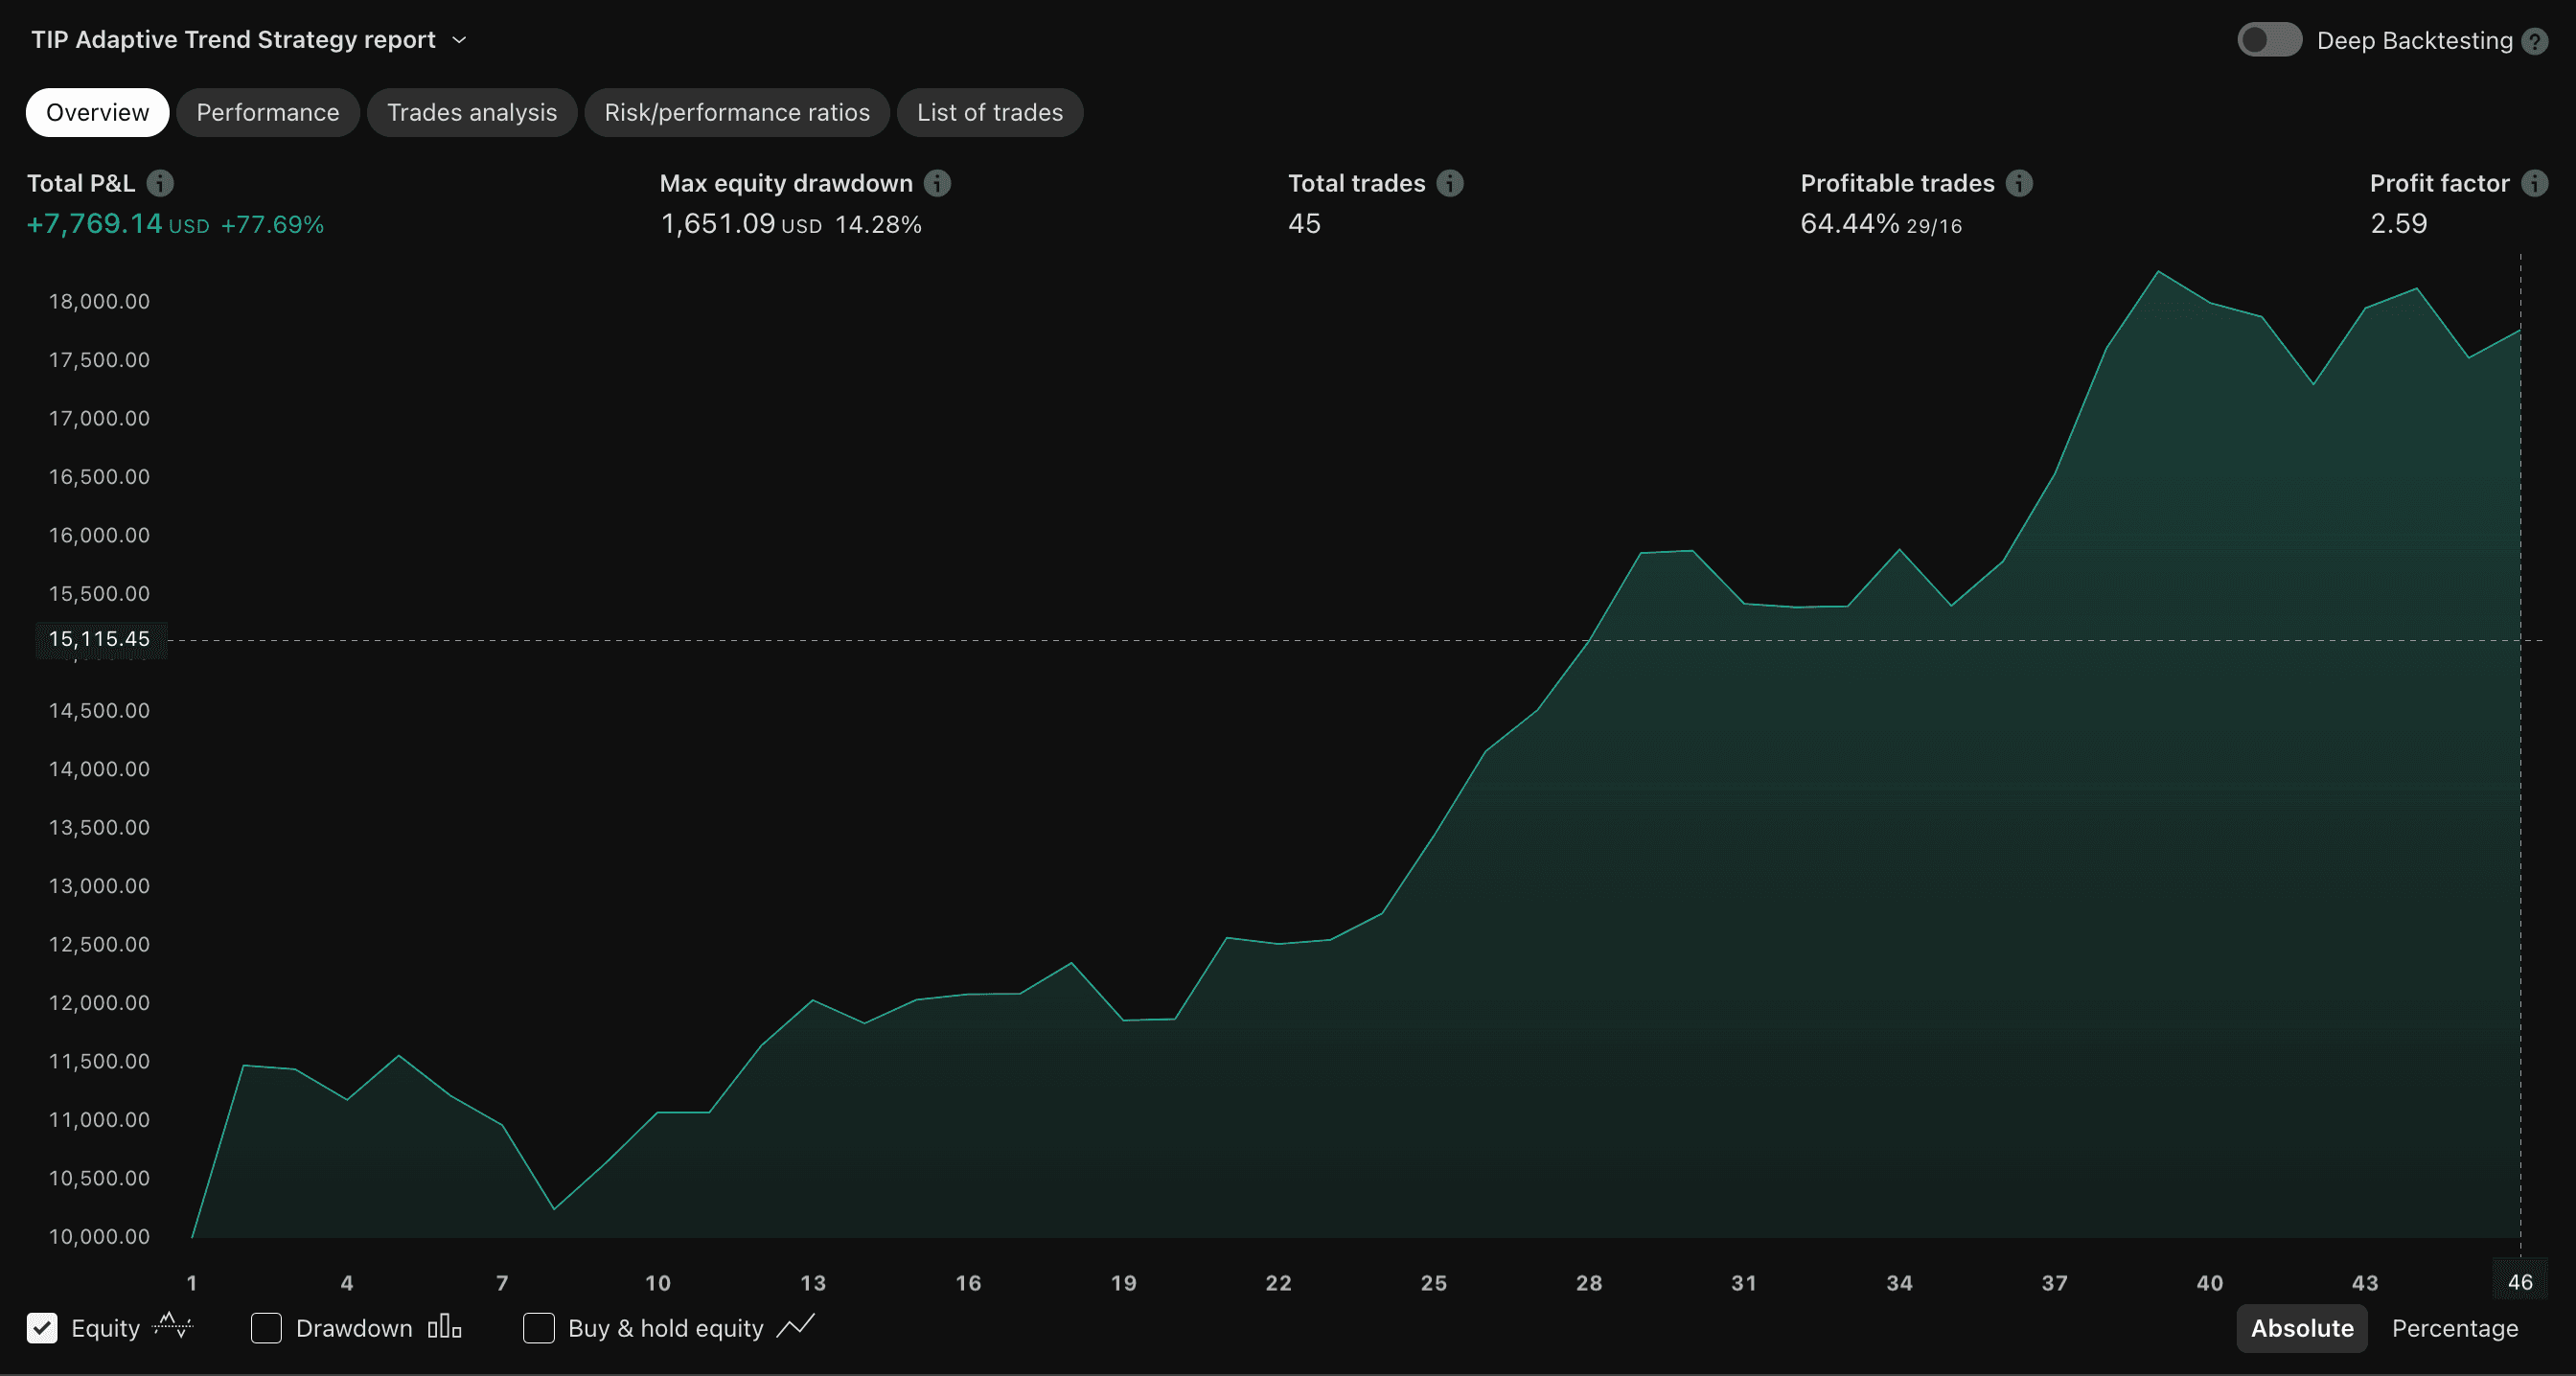
Don't just focus on total return. Evaluate these key metrics:
1. Risk-Adjusted Returns
The Sharpe Ratio measures return per unit of risk:
// Calculate annualized Sharpe Ratio
returns = strategy.netprofit / strategy.initial_capital
riskFreeRate = 0.02 // 2% annual risk-free rate
stdDev = ta.stdev(strategy.netprofit, 252) / strategy.initial_capital
sharpeRatio = (returns - riskFreeRate) / stdDev
A Sharpe Ratio above 1 is considered acceptable, above 2 is good, and above 3 is excellent.
2. Maximum Drawdown
This measures your strategy's largest peak-to-trough decline:
plot(strategy.max_drawdown, "Maximum Drawdown", color=color.red)A strategy with a 50%+ drawdown might be psychologically difficult to trade, even if profitable overall.
3. Win Rate and Profit Factor
plot(strategy.win_rate, "Win Rate", color=color.green)
plot(strategy.profit_factor, "Profit Factor", color=color.blue)
While win rate isn't everything, a profit factor (gross profits divided by gross losses) below 1.5 often indicates a fragile strategy.
Practical Example: Building a Robust Backtesting Framework
Let's create a more comprehensive backtesting framework incorporating these principles:
//@version=5
strategy("Robust Backtest Framework", overlay=true,
         initial_capital=10000,
         commission_type=strategy.commission.percent,
         commission_value=0.1,
         slippage=2,
         default_qty_type=strategy.percent_of_equity,
         default_qty_value=10) // Risk 10% per trade

// Parameters
fastLength = input(14, "Fast MA Length")
slowLength = input(28, "Slow MA Length")
atrPeriod = input(14, "ATR Period")
atrMultiplier = input(2.0, "ATR Stop Multiplier")

// Indicators
fastMA = ta.sma(close, fastLength)
slowMA = ta.sma(close, slowLength)
atr = ta.atr(atrPeriod)

// Trading conditions
longCondition = ta.crossover(fastMA, slowMA)
shortCondition = ta.crossunder(fastMA, slowMA)

// Calculate stop loss distance based on ATR
stopLoss = atrMultiplier * atr

// Execute trades with dynamic stops
if (longCondition)
    strategy.entry("Long", strategy.long)
    strategy.exit("Long Exit", "Long", stop=close - stopLoss)

if (shortCondition)
    strategy.close("Long")

// Performance metrics tracking
var float maxEquity = strategy.equity
if strategy.equity > maxEquity
    maxEquity := strategy.equity

drawdown = ((maxEquity - strategy.equity) / maxEquity) * 100
plot(drawdown, "Current Drawdown %", color=color.red)
This framework includes:
- Realistic trading costs
- Position sizing based on equity percentage
- Dynamic stop losses based on market volatility (ATR)
- Real-time drawdown tracking
Validating Strategy Performance Across Different Timeframes
A truly robust strategy should work reasonably well across multiple timeframes. TradingView allows you to easily switch between timeframes when backtesting.
The best strategies often show consistent (though not necessarily identical) performance across related timeframes. For example, if your strategy works on the 1-hour chart, it should show some level of effectiveness on the 30-minute and 4-hour charts as well.
The Role of Fundamental Analysis in Backtesting
While TradingView excels at technical analysis, fundamental factors can significantly impact performance. Consider these approaches:
- Test strategies on different asset classes (stocks vs. forex vs. crypto)
- Filter trades based on broader market conditions (e.g., only trade long during bull markets)
- Use sentiment indicators when available
Taking Your Strategy Live
After thorough backtesting, consider these steps before trading real capital:
- Paper Trading: TradingView offers paper trading to simulate real trading without financial risk.
- Start Small: Begin with smaller position sizes than your backtest to account for the difference between theory and practice.
- Monitor Performance: Track key metrics and compare them to your backtest expectations, adjusting as needed.
- Keep a Trading Journal: Document why trades were taken and their outcomes to identify patterns not visible in backtesting.
Conclusion: The Continuous Improvement Cycle
Backtesting is not a one-time activity but an ongoing process. Markets evolve, and strategies that worked in the past may become less effective. Professional traders continuously:
- Test new hypotheses
- Refine existing strategies
- Validate performance across different market conditions
- Incorporate new data sources and techniques
By following the comprehensive backtesting framework outlined in this guide, you'll be better equipped to develop trading strategies with genuine edge and longevity.
Remember that no backtest can perfectly predict future performance, but thorough testing significantly improves your chances of trading success.


