Mastering Risk-to-Reward Ratios: The Secret Weapon for Consistent Trading Profits
Discover how properly implementing risk-to-reward ratios can transform your trading strategy from unpredictable to consistently profitable.
Why Most Traders Fail (And How Risk-to-Reward Ratios Can Save Your Portfolio)
As a trader, have you ever experienced a winning streak only to watch your account balance plummet afterward? You're not alone. Studies consistently show that approximately 90% of retail traders lose money in the markets. But here's the surprising truth: many unsuccessful traders actually have a positive win rate. So why do they still lose overall?
The answer often lies in poor risk management—specifically, neglecting the critical concept of risk-to-reward ratios.
In this comprehensive guide, we'll explore how mastering risk-to-reward ratios can transform your trading performance from unpredictable to consistently profitable, even without increasing your win rate. You'll learn practical methods to implement, automate, and optimize these ratios using TradingView's powerful scripting capabilities.
What Is a Risk-to-Reward Ratio (And Why It's More Important Than Your Win Rate)
The risk-to-reward ratio (R:R ratio) represents the relationship between the amount of money you're risking on a trade versus the potential profit you stand to gain. Expressed mathematically:
R:R Ratio = Potential Loss / Potential Profit
For example, if you risk $100 to potentially gain $300, your R:R ratio is 1:3.
Here's why this concept is so powerful: you can be wrong more often than you're right and still be profitable overall if your R:R ratio is favorable enough.
Consider these two hypothetical trading approaches:
Trader A:
- Win rate: 70%
- R:R ratio: 2:1 (risking $2 to make $1)
- After 10 trades: 7 wins × $1 gain = $7, 3 losses × $2 loss = $6
- Net result: +$1
Trader B:
- Win rate: 40%
- R:R ratio: 1:3 (risking $1 to make $3)
- After 10 trades: 4 wins × $3 gain = $12, 6 losses × $1 loss = $6
- Net result: +$6
Despite having a significantly lower win rate, Trader B outperforms Trader A by prioritizing favorable R:R ratios. This mathematical advantage compounds dramatically over hundreds or thousands of trades.
How to Calculate Your Optimal Risk-to-Reward Ratio
Finding your optimal R:R ratio depends on your trading strategy's inherent win rate. The relationship can be expressed with this formula:
Minimum Win Rate Required for Profitability = Risk / (Risk + Reward)
For example, with a 1:2 R:R ratio, you need a win rate higher than 33.3% to be profitable: 1 / (1 + 2) = 1/3 = 33.3%
Here's a quick reference table:
| R:R Ratio | Minimum Win Rate Required |
|---|---|
| 1:1 | 50% |
| 1:2 | 33.3% |
| 1:3 | 25% |
| 1:4 | 20% |
| 2:1 | 66.7% |
| 3:1 | 75% |
The key insight: the better your R:R ratio, the lower your required win rate for profitability.
Implementing Risk-to-Reward Ratios in TradingView
TradingView offers several powerful tools to help you implement and visualize R:R ratios in your trading:
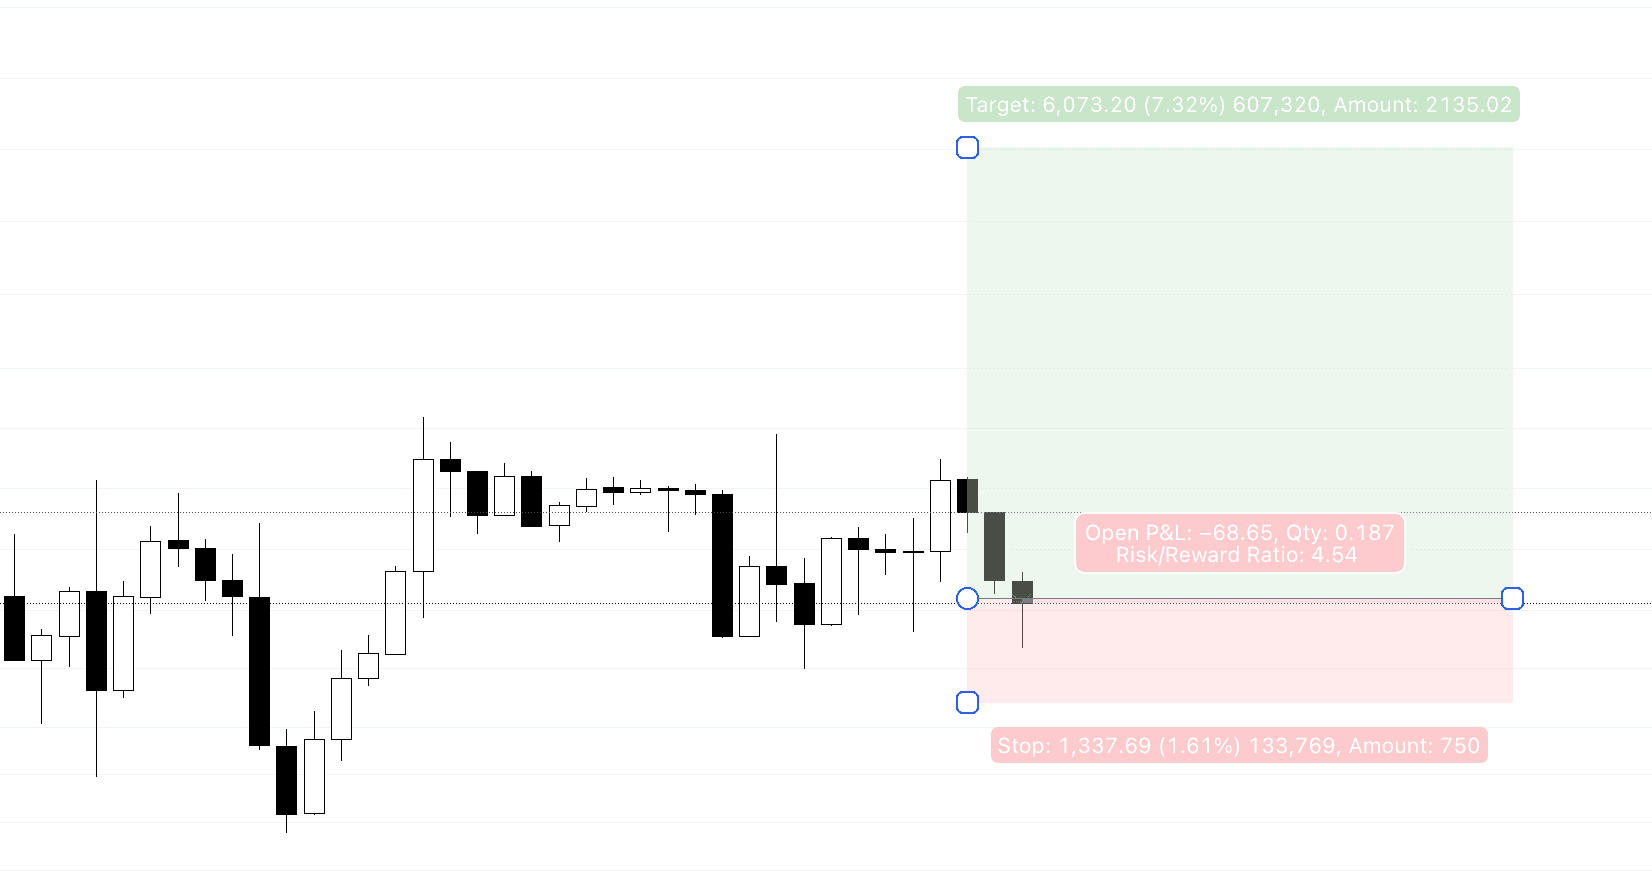
Method 1: Using the Built-in Risk/Reward Tool
- Select the Risk/Reward tool from the drawing tools panel
- Click on your entry point
- Drag to your stop-loss level
- Extend to your take-profit target
- TradingView will automatically calculate and display the R:R ratio
This manual approach works well for discretionary traders analyzing individual setups.
Method 2: Creating Custom Risk-Reward Indicators with Pine Script
For more advanced traders, TradingView's Pine Script allows you to create custom indicators that automatically calculate and display R:R ratios based on your strategy's specific rules.
Here's a simple example of Pine Script code that identifies potential trade setups with a minimum 1:2 R:R ratio using a basic moving average crossover strategy:
//@version=5
indicator("R:R Ratio Finder", overlay=true)

// Strategy parameters
fastLength = input(9, "Fast MA Length")
slowLength = input(21, "Slow MA Length")
atrPeriod = input(14, "ATR Period")
minRRRatio = input(2.0, "Minimum R:R Ratio")

// Calculate moving averages
fastMA = ta.sma(close, fastLength)
slowMA = ta.sma(close, slowLength)

// Calculate ATR for stop loss placement
atr = ta.atr(atrPeriod)

// Detect crossovers
bullishCross = ta.crossover(fastMA, slowMA)
bearishCross = ta.crossunder(fastMA, slowMA)

// Calculate potential entry, stop loss, and take profit levels
// For long setups
longEntry = close
longStop = longEntry - atr * 1.5
longTarget = longEntry + (longEntry - longStop) * minRRRatio

// For short setups
shortEntry = close
shortStop = shortEntry + atr * 1.5
shortTarget = shortEntry - (shortStop - shortEntry) * minRRRatio

// Plot signals with R:R ratio label
if bullishCross
    label.new(bar_index, low - atr, "LONG\nR:R 1:" + str.tostring(minRRRatio), color=color.green, style=label.style_label_up)
    strategy.entry("Long", strategy.long, comment="Long Entry")
    strategy.exit("Exit Long", "Long", stop=longStop, limit=longTarget)

if bearishCross
    label.new(bar_index, high + atr, "SHORT\nR:R 1:" + str.tostring(minRRRatio), color=color.red, style=label.style_label_down)
    strategy.entry("Short", strategy.short, comment="Short Entry")
    strategy.exit("Exit Short", "Short", stop=shortStop, limit=shortTarget)

// Plot levels for visualization
plot(fastMA, "Fast MA", color.blue)
plot(slowMA, "Slow MA", color.red)
This script:
- Identifies potential trade setups using a moving average crossover
- Calculates stop-loss levels based on the Average True Range (ATR)
- Ensures take-profit targets maintain at least a 1:2 risk-to-reward ratio
- Labels each setup with the corresponding R:R ratio
- Plots relevant levels for visual confirmation
Advanced Risk-Reward Optimization Techniques
Once you've implemented basic R:R ratio management, consider these advanced techniques to further optimize your trading:
1. Dynamic R:R Ratios Based on Market Conditions
Markets aren't static—they alternate between trending and ranging conditions. Your R:R expectations should adapt accordingly:
- In strong trends: Target higher R:R ratios (1:3 or greater)
- In choppy, ranging markets: Accept lower R:R ratios (1:1.5 to 1:2)
You can program TradingView strategies to automatically adjust R:R ratios based on indicators like ADX (Average Directional Index) or ATR (Average True Range) to measure trend strength.
2. Implementing Tiered Take-Profit Levels
Rather than using a single take-profit target, consider a tiered approach:
- Close 1/3 of position at 1:1 R:R (securing some profit)
- Close 1/3 at 1:2 R:R
- Let the final 1/3 run with a trailing stop for potentially larger gains
This approach balances the certainty of securing some profit against the opportunity for larger gains when the market moves strongly in your favor.
3. Backtesting Different R:R Configurations
TradingView's Strategy Tester allows you to backtest different R:R configurations across various market conditions. This empirical testing helps identify the optimal balance for your specific trading approach.
Key metrics to evaluate:
- Net profit
- Maximum drawdown
- Profit factor
- Win rate
- Average win/loss ratio
Common Mistakes to Avoid When Implementing Risk-to-Reward Ratios
Even with a sound understanding of R:R principles, traders often make these critical mistakes:
1. Setting Unrealistic Targets
While a 1:5 R:R ratio looks fantastic on paper, it may be unrealistic in certain market conditions or timeframes. Base your targets on actual market structure (support/resistance levels, previous swing highs/lows) rather than arbitrary multiples.
2. Moving Stop Losses to Break Even Too Early
Many traders move their stops to break even at the first sign of profit, thinking they're eliminating risk. This often results in getting stopped out of otherwise profitable trades before they have room to develop, effectively reducing your win rate without improving your R:R.
3. Ignoring Market Structure in Favor of Fixed R:R
Blindly applying a fixed R:R ratio to every trade regardless of market context leads to suboptimal results. Your R:R should respect key market levels—placing stops just beyond logical support/resistance and targeting the next significant level.
4. Neglecting Position Sizing
Even the best R:R ratio cannot save you if your position sizing is too aggressive. Always combine proper R:R planning with appropriate position sizing (typically risking no more than 1-2% of your account per trade).
Automating Your Risk-Reward Strategy with Custom TradingView Scripts
The ultimate evolution of R:R management is full automation through custom TradingView strategies. This eliminates emotional decision-making and ensures consistent application of your risk parameters.
At trading-strategies.co, we specialize in developing custom Pine Script strategies that incorporate sophisticated risk-to-reward management. Our proprietary algorithms adapt to changing market conditions while maintaining strict risk controls.
Case Study: How Proper R:R Management Transformed a Struggling Trader's Results
John, a client of trading-strategies.co, had been trading for three years with mixed results. His win rate was respectable at 55%, but his overall account growth was minimal. After analyzing his trading journal, we discovered his average R:R ratio was approximately 1.5:1—he was risking more than he was gaining on each trade.
By implementing one of our custom TradingView strategies with built-in R:R management, John made three key changes:
- Set minimum R:R ratio requirements of 1:1.5 for all trades
- Implemented tiered take-profit levels
- Used our dynamic stop-loss algorithm that adjusts based on volatility
The results after six months:
- Win rate: Decreased slightly to 48%
- Average R:R ratio: Improved to 1:2.2
- Net profitability: Increased by 132%
- Maximum drawdown: Reduced by 41%
This real-world example demonstrates how focusing on R:R management often produces better results than obsessing over win rate.
Tools and Resources to Improve Your Risk-Reward Implementation
To help you master risk-to-reward management, consider these resources:
- TradingView's Risk/Reward Tool: Available on all TradingView charts
- Position Size Calculator: Determine optimal position sizes based on your stop-loss placement
- Trading Journal Software: Track your R:R ratios across different strategies and market conditions
- Custom Pine Script Indicators: Automate R:R calculations for your specific strategy
Conclusion: The Path to Consistent Profitability Through Risk-Reward Mastery
Mastering risk-to-reward ratios isn't just about understanding a mathematical concept—it's about implementing a systematic approach to trading that puts probabilities in your favor over the long term.
Remember these key takeaways:
- A favorable R:R ratio can make you profitable even with a win rate below 50%
- Your minimum required win rate decreases as your R:R ratio improves
- TradingView provides powerful tools to implement and automate R:R management
- Custom Pine Script strategies can optimize your R:R approach for different market conditions
If you're ready to transform your trading through proper risk-to-reward management, explore our custom TradingView strategies at trading-strategies.co. Our professionally designed algorithms incorporate sophisticated R:R management tailored to different market conditions and trading styles.
Don't just hope for profitable trades—systematically engineer them through proper risk-to-reward management.